Detection of pulsed radio emission from bursting Magnetar XTE1810-197 below 750 MHz with the uGMRT
ATel #12312; Bhal Chandra Joshi (NCRA-TIFR, Pune, India), Yogesh Maan (ASTRON, Netherlands), Mayuresh P Surnis(WVU, USA), Manjari Bagchi(IMSc-HBNI, Chennai, India), P. K. Manoharan(RAC, Ooty, India)
on 20 Dec 2018; 10:49 UT
Credential Certification: Bhal Chandra Joshi (bcj@ncra.tifr.res.in)
Subjects: Radio, Neutron Star, Soft Gamma-ray Repeater, Star, Pulsar, Magnetar
Intense radio emission from the magnetar XTE J1810-197 (Gotthelf et al. 2003,
Ibrahim et al. 2004) has recently been reported in monitoring
observations with the Lovell radio telescope (Lyne et al. 2018, ATEL
#12284). These observations have been at higher frequencies
and subsequent follow-up have detected pulsation at frequencies
above 835 MHz (Lyne et al. 2018, ATEL #12284; Desvignes et al. 2018,
ATEL #12285; Lower et al. 2018, ATEL #12288). Although the source is near
Sun, enhanced high energy emission is also indicated in follow up
observations (Mihara et al. 2018, ATel #12291; Gotthelf et al. 2018,
ATEL #12297). This is only second such outburst accompanied
by radio emission from this unique magnetar in last 10 years, during
which the source was in quiescence state (Camilo et al. 2006;
Camilo et al. 2016)
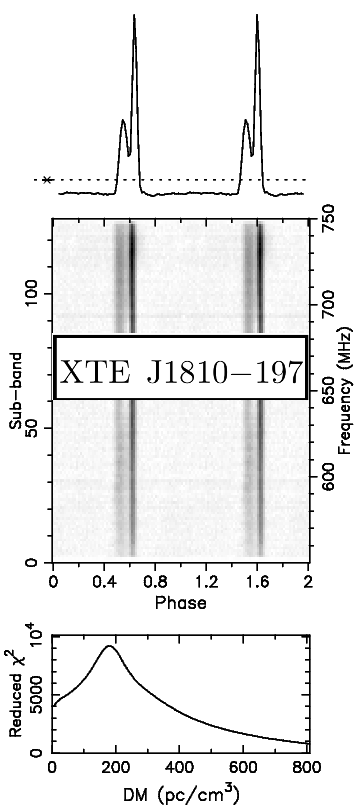
We observed this source for about 40 minutes with the upgraded
GMRT (Gupta et al. 2018) using a phased array of 19 antennas
at Band 4 between 550-750 MHz. We recorded the data with 4096 channels
across 200 MHz bandwidth with a sampling time of 1.3 ms. Intense
single pulses were detected with 35 to 70 signal-to-noise ratio (S/N).
Our best estimate of the period and DM are 5.54156(7) s
and 181(5) respectively. The average profile with very high S/N of
about 700 shows two
distinct components with a large and narrow trailing component
following a smaller and wider leading component. The emission
was seen across the whole band from 550 to 750 MHz. The profile
evolves across the band with the ratio of peak of trailing
component to leading component varying from 2.7 to 3 from 550 to 750
MHz. Our preliminary estimate of the source flux density averaged
over the full bandwidth is 17(7) mJy. We also notice a significant
evolution of the flux density across the observed bandwidth.
Plot of the detection can be found at
XTE J1810-197 .
The individual profiles for four
sub-bands across 200 MHz bandwidth can be seen in this
sub-band plot .
The
time and frequency variations with phase are in
this summary plot .
Further observations at even lower frequencies (300-500 MHz) as well
as the same band are scheduled. We will continue to monitor the source
at frequencies 300-750 MHz using the uGMRT.
We thank the GMRT staff members for making these
observations possible at short notice. We are also thankful
for a prompt allocation of Director's discretionary time for
these observations.


