Multi-band optical observations of V404 Cygni and correlated spectral changes
ATel #7737; John Scarpaci, Dipankar Maitra (Wheaton College, MA), Rob Hynes (Louisiana State University), Sera Markoff (API, Amsterdam)
on 30 Jun 2015; 17:08 UT
Credential Certification: Dipankar Maitra (maitra_dipankar@wheatoncollege.edu)
Subjects: Optical, Binary, Black Hole, Transient
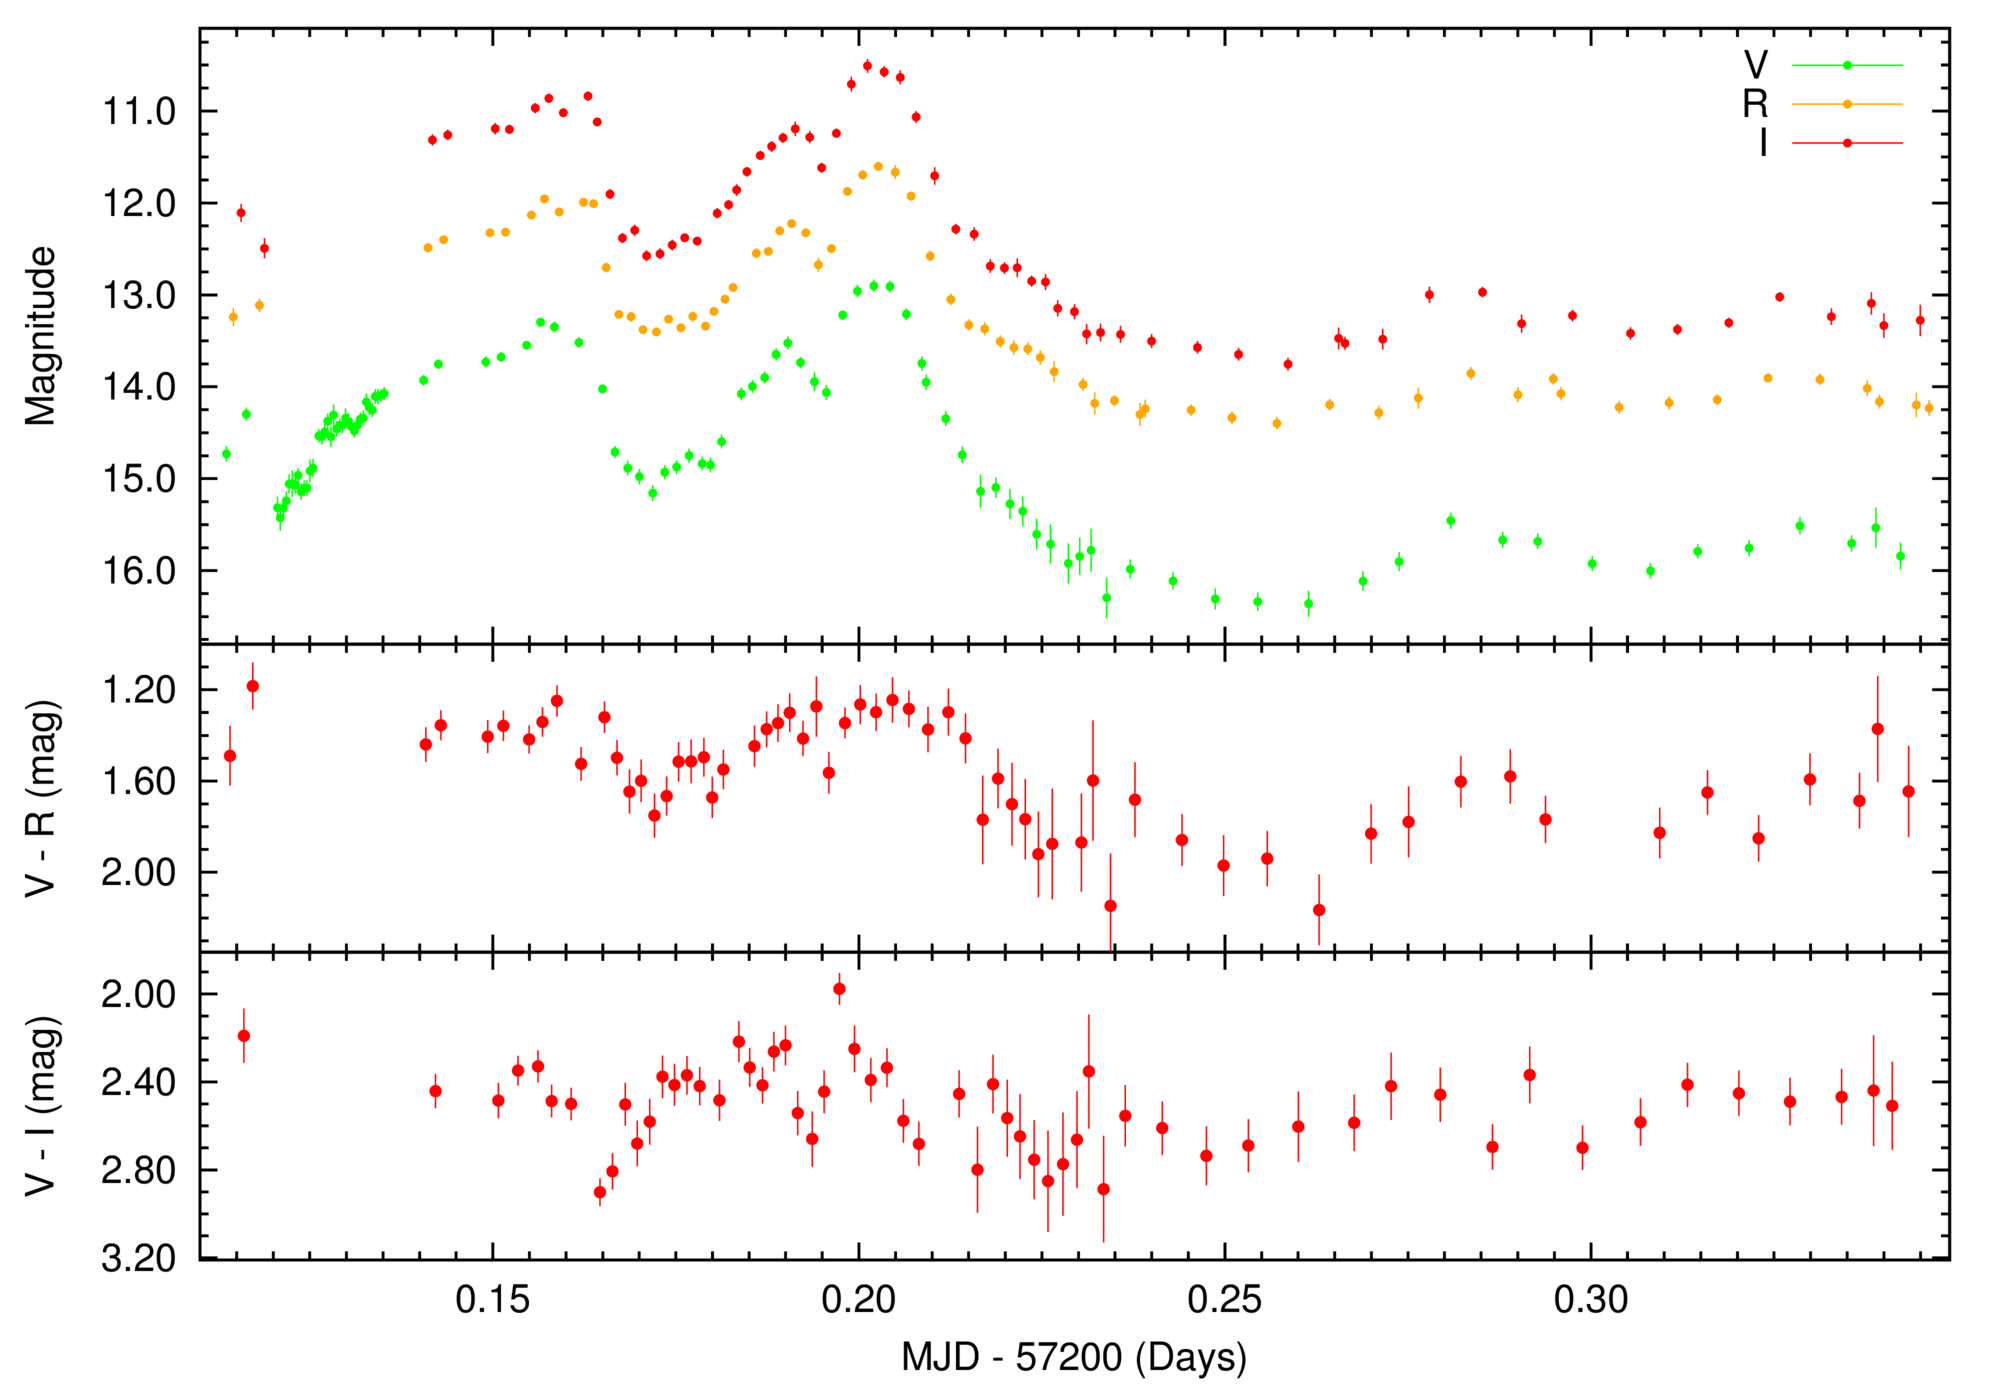
We report optical observations of V404 Cygni between 2015 June 27.10 - 27.34 UT made using Wheaton College Observatory's 0.3m telescope. During the course of the night observations were made by continuously cycling through V, R, and I band Johnson/Cousins filters. Initial exposures at the beginning of the night were 30s in each filter. However as the brightness of the source started decreasing rapidly after midnight (local time), we switched to 5 minute exposures
in V, and 1 minute exposures in R and I.
The V, R, and I light curves are shown in the top panel of this figure. Strong variability and flaring activity, as has been characteristic of this outburst of V404 Cyg, was noticed in all bands. An especially prominent feature in the light curve morphology is the flare that peaked at around MJD 57200.2 and then decayed by a factor of ~25x in 1.2 hours in the V-band. Also, the baseline V band flux level during this night had decreased to about 15.5 mag from 12.1 mag in the two days since our previous observation on MJD 57198 (ATEL #7721). This decrease is consistent with the r' band decay reported in ATEL #7729. A dramatic decrease in the X-ray and radio flux has also been recently observed (see ATEL #7731 and #7733).
Preliminary inspection of the V-R color, shown in the middle panel of this figure, shows clear evidence of spectral evolution during the course of the observing run. Especially, the V-R color became significantly bluer during the flare peaks than compared to the dips. A similar correlated change may be present in the V-I color (the bottom panel of this figure), but with lower statistical significance.
The origin of this complex spectral variability is uncertain. However a simple scenario that relies on the fact that (a) the Hα emission line lies in the middle of the R band, and (b) a strong Hα emission with an equivalent width of 273-299A was seen during this outburst (ATEL #7659), could qualitatively explain our observations as follows: Say the flares are dominated by nonthermal processes, e.g. jet synchrotron originating from a small spatial region, and varying rapidly in V, R, and I bands. If the strong Hα emission is primarily from the accretion disk (with a comparatively larger emission area and hence slower/lesser variability) and not affected by the flare, then it can potentially dilute the R band variability. As the flare continuum drops, the
continuum-dominated V and I bands will drop by more than the R band which is held up by the line. Further detailed analysis, as well as denser temporal as well as wavelength coverage is needed to better understand this enigmatic source.
V, R, and I band light curves, and the evolution of V-R and V-I color


